The BitcoinScript Debugger
BitcoinScript comes with an in-terminal ascii-graphical debugger.
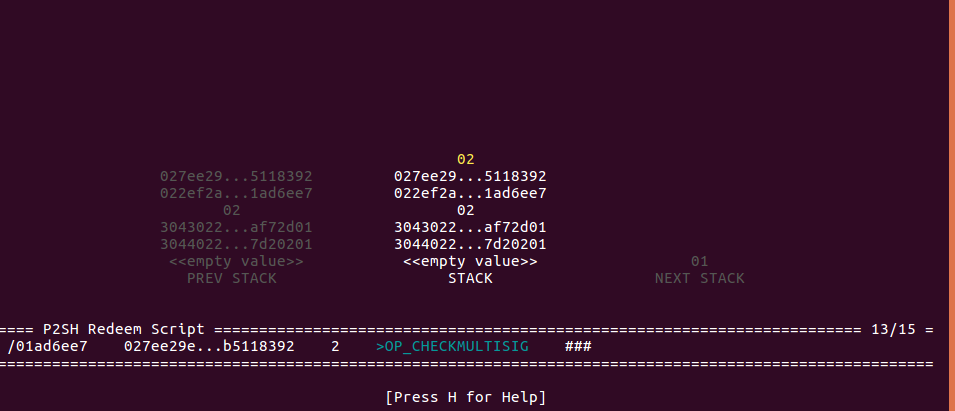
The debugger lets you navigate between script execution steps, while displaying the states of the stack and tape.
Screenshots
Starting the Debugger
Programmatically
Call run_in_debugger().
The simplest example is loading a sample script along with its execution-args (flags and context), and passing them on to run_in_debugger():
from bitcoinscript.debugger import run_in_debugger
from bitcoinscript.samples import get_sample_exec_args
a, kw = get_sample_exec_args('P2PKH')
run_in_debugger(*a, **kw)
From interactive shell
Interactive shell’s Sdebug command invokes the debugger with the scripts the interactive session is loaded with (or the scripts interactively composed in it).
The simplest example is loading a sample script to the interactive shell, and then invoking the debugger:
# load the sample script:
Sloadsample P2SH P2MULTISIG
# start the debugger:
Sdebug
See the docs for more details about using the interactive shell.
Try it out from command line
Simply run debug_sample.py script and specify a predefined sample script. For example:
python3 bitcoinscript/bin/debug_sample.py P2PKH
Using the Debugger
Once you start a debugger session, use the arrow keys to navigate forward and backward.
Press “Q” to quit.
Press “H” to see a HELP screen.